U.S. Spirits Industry Analysis Report
Volume Trends, Market Share Evolution & Forecasting (2003-2024)
Data Source: Distilled Spirits Council of the United States (DISCUS)
Note: 2025 data has not yet been compiled. Forecasts are based on 2024 actuals. | Report Generated: January 2026
Executive Summary
- Volume vs Value: Total volume reached 312M cases in 2024 (+1.1%), but revenue declined to $37.2B (-1.1%). The industry is growing in volume while shrinking in value.
- Biggest Volume Winner: RTDs grew from near-zero to 73M cases; Tequila/Mezcal grew 302% (8M to 32M cases)
- Biggest Loser: Rum peaked in 2013 and declined 19%, losing 4.3pp market share
- Vodka Maturation: Still largest at 74M cases (33% share), but peaked 2021 and now declining
- Whiskey Renaissance: American Whiskey (+126%) and Irish Whiskey (+884%) drove growth
- 2025-2029 Outlook: Volume may grow with RTD expansion, but industry value at risk. Premiumization stalled; consumers trading down.
Volume Trends (2003-2024)
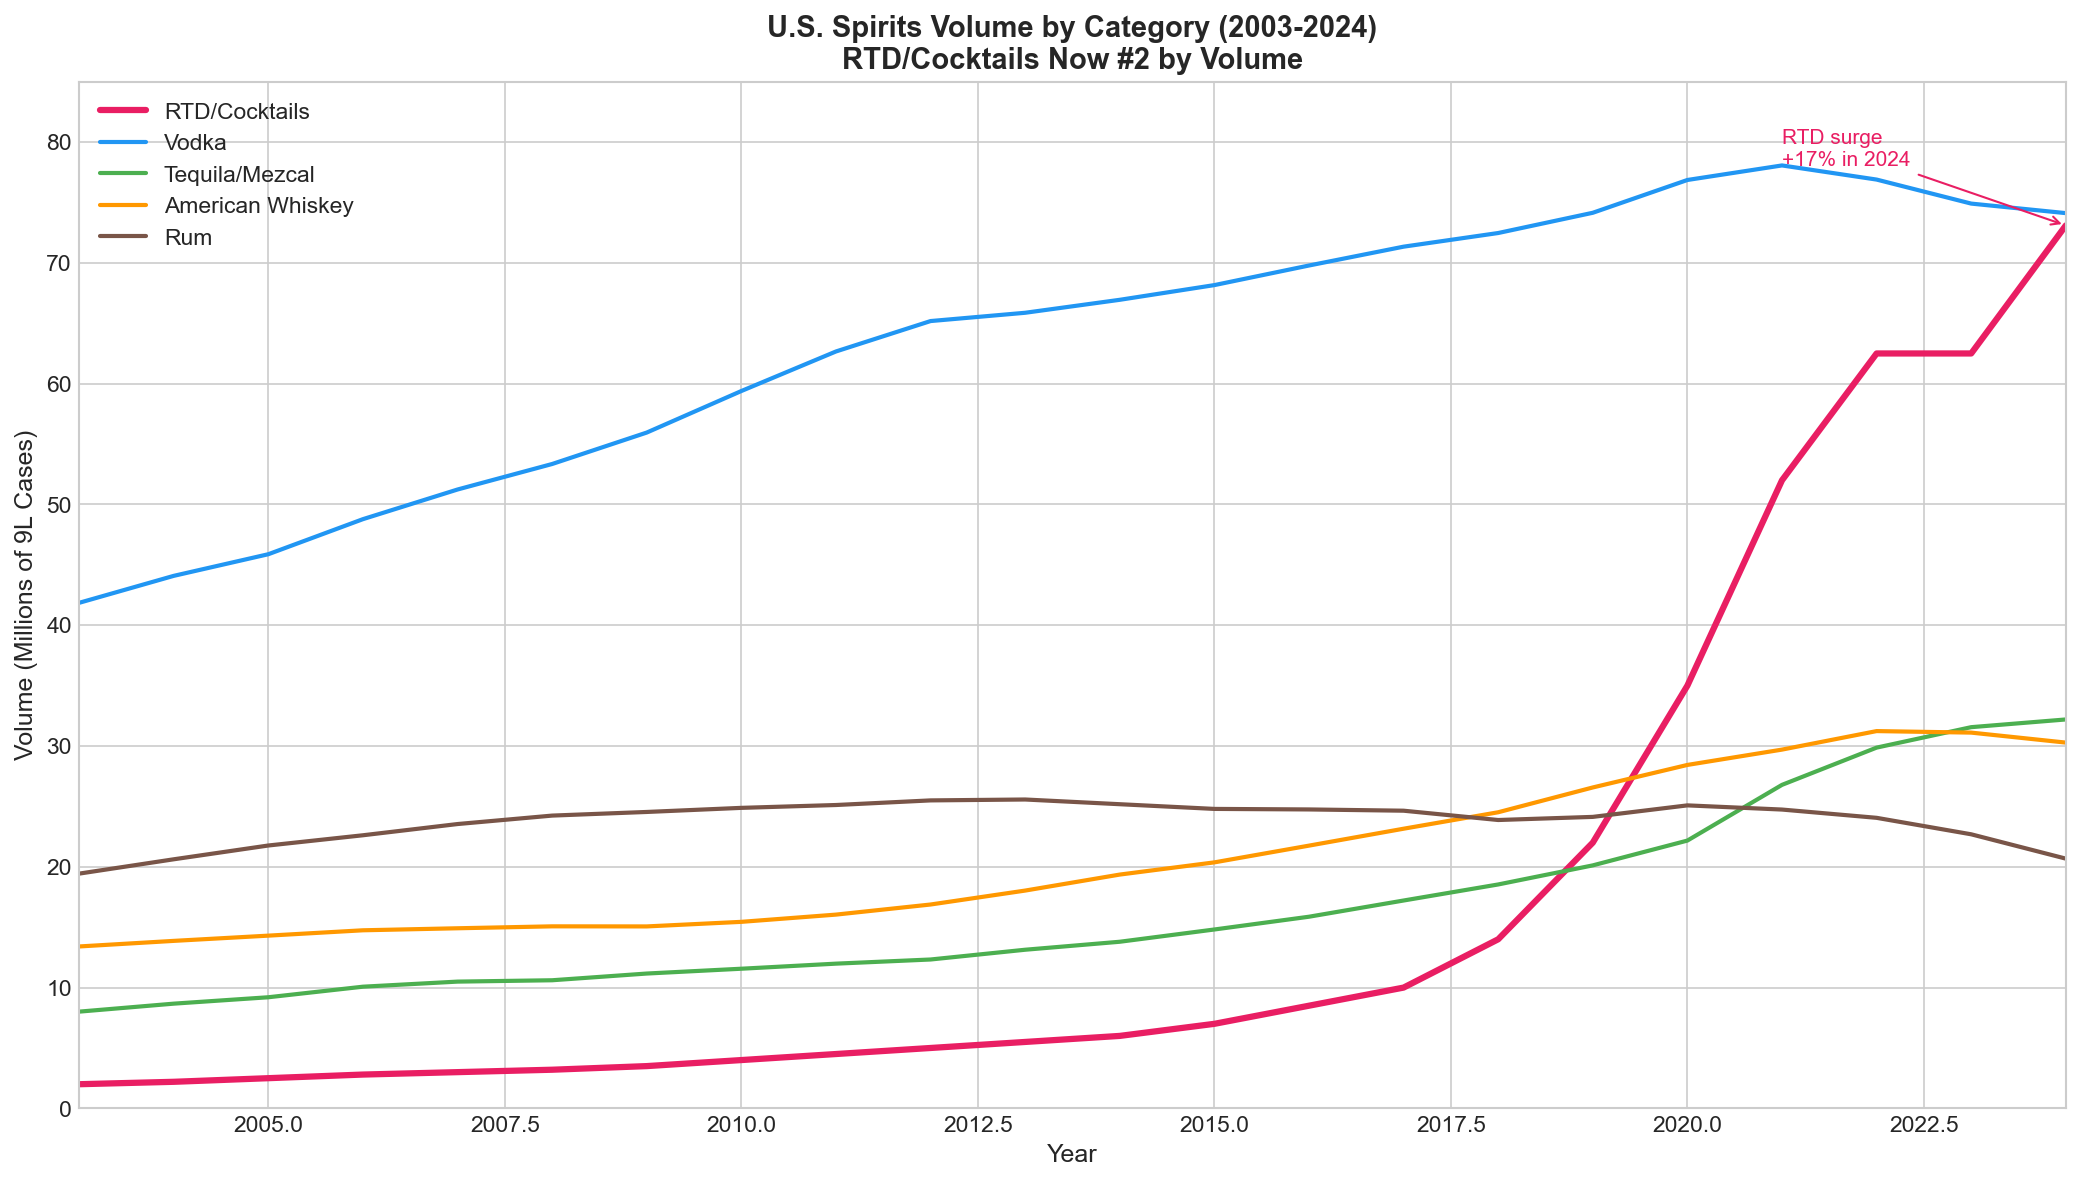
Figure 1: U.S. Spirits Volume by Category
Growth Analysis
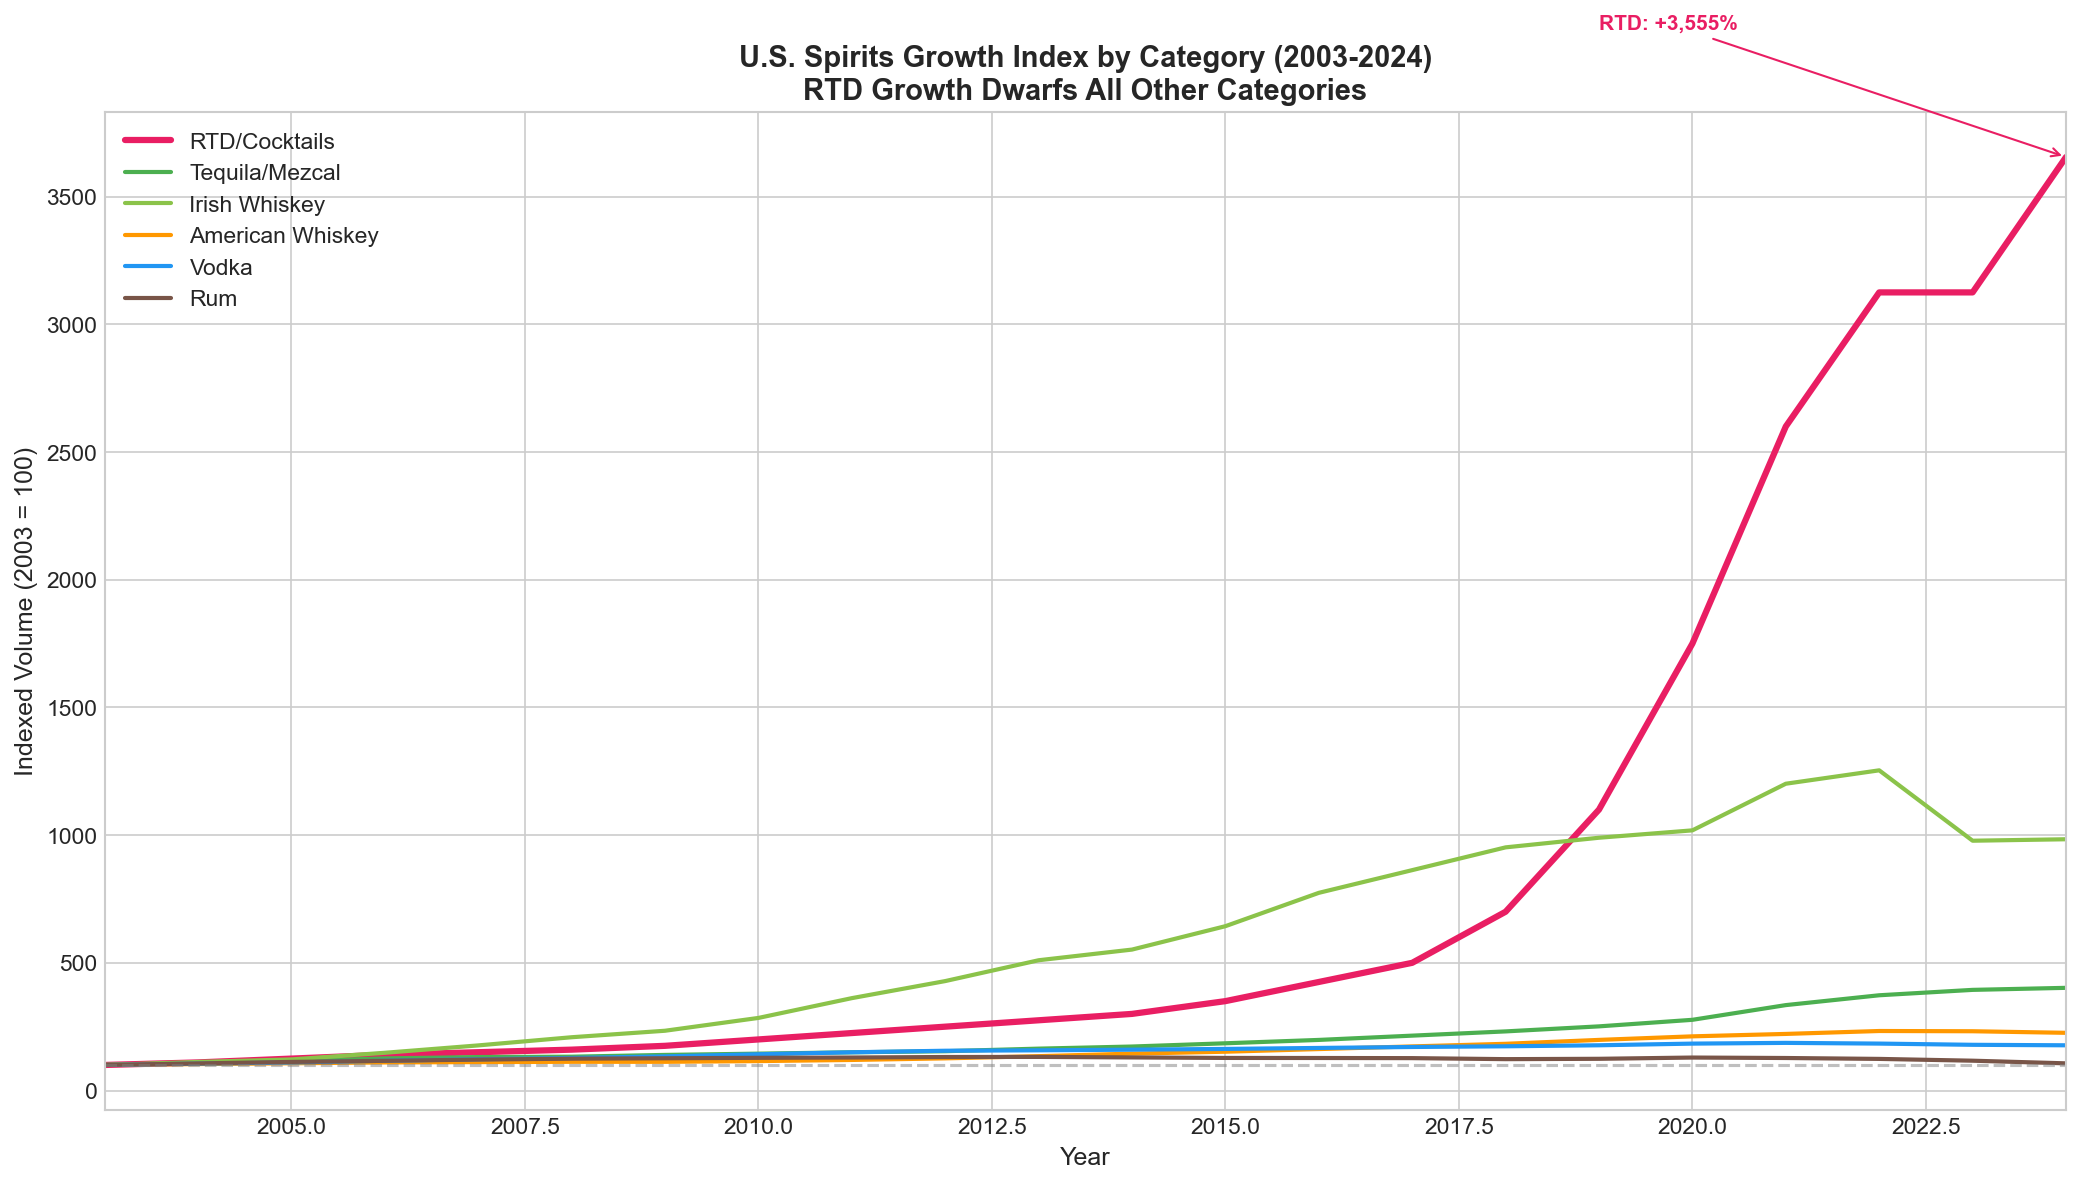
Figure 2: Indexed Growth (2003 = 100) - Irish Whiskey and Tequila dramatically outperformed
Growth Metrics by Category
| Category | 2003 | 2024 | Peak | Peak Year | Total Growth | 21-Yr CAGR |
|---|---|---|---|---|---|---|
| RTD/Cocktails | 2.0 | 73.1 | 73.1 | 2024 | +3,555% | +19.2% |
| Irish Whiskey | 0.5 | 5.5 | 6.1 | 2022 | +994.0% | +12.2% |
| Tequila/Mezcal | 8.0 | 32.2 | 32.2 | 2024 | +302.0% | +6.9% |
| American Whiskey | 13.4 | 30.3 | 31.2 | 2022 | +125.9% | +4.0% |
| Vodka | 41.9 | 74.1 | 78.1 | 2021 | +77.1% | +2.8% |
| Brandy/Cognac | 10.2 | 11.7 | 16.5 | 2021 | +14.7% | +0.7% |
| Canadian Whisky | 15.3 | 17.3 | 19.4 | 2021 | +13.5% | +0.6% |
| Rum | 19.4 | 20.7 | 25.6 | 2013 | +6.4% | +0.3% |
| Cordials/Liqueurs | 18.9 | 20.1 | 22.0 | 2021 | +6.1% | +0.3% |
| Gin | 8.3 | 8.3 | 8.7 | 2007 | 0.0% | 0.0% |
| Scotch | 9.3 | 7.9 | 9.8 | 2021 | -15.6% | -0.8% |
Market Share Evolution
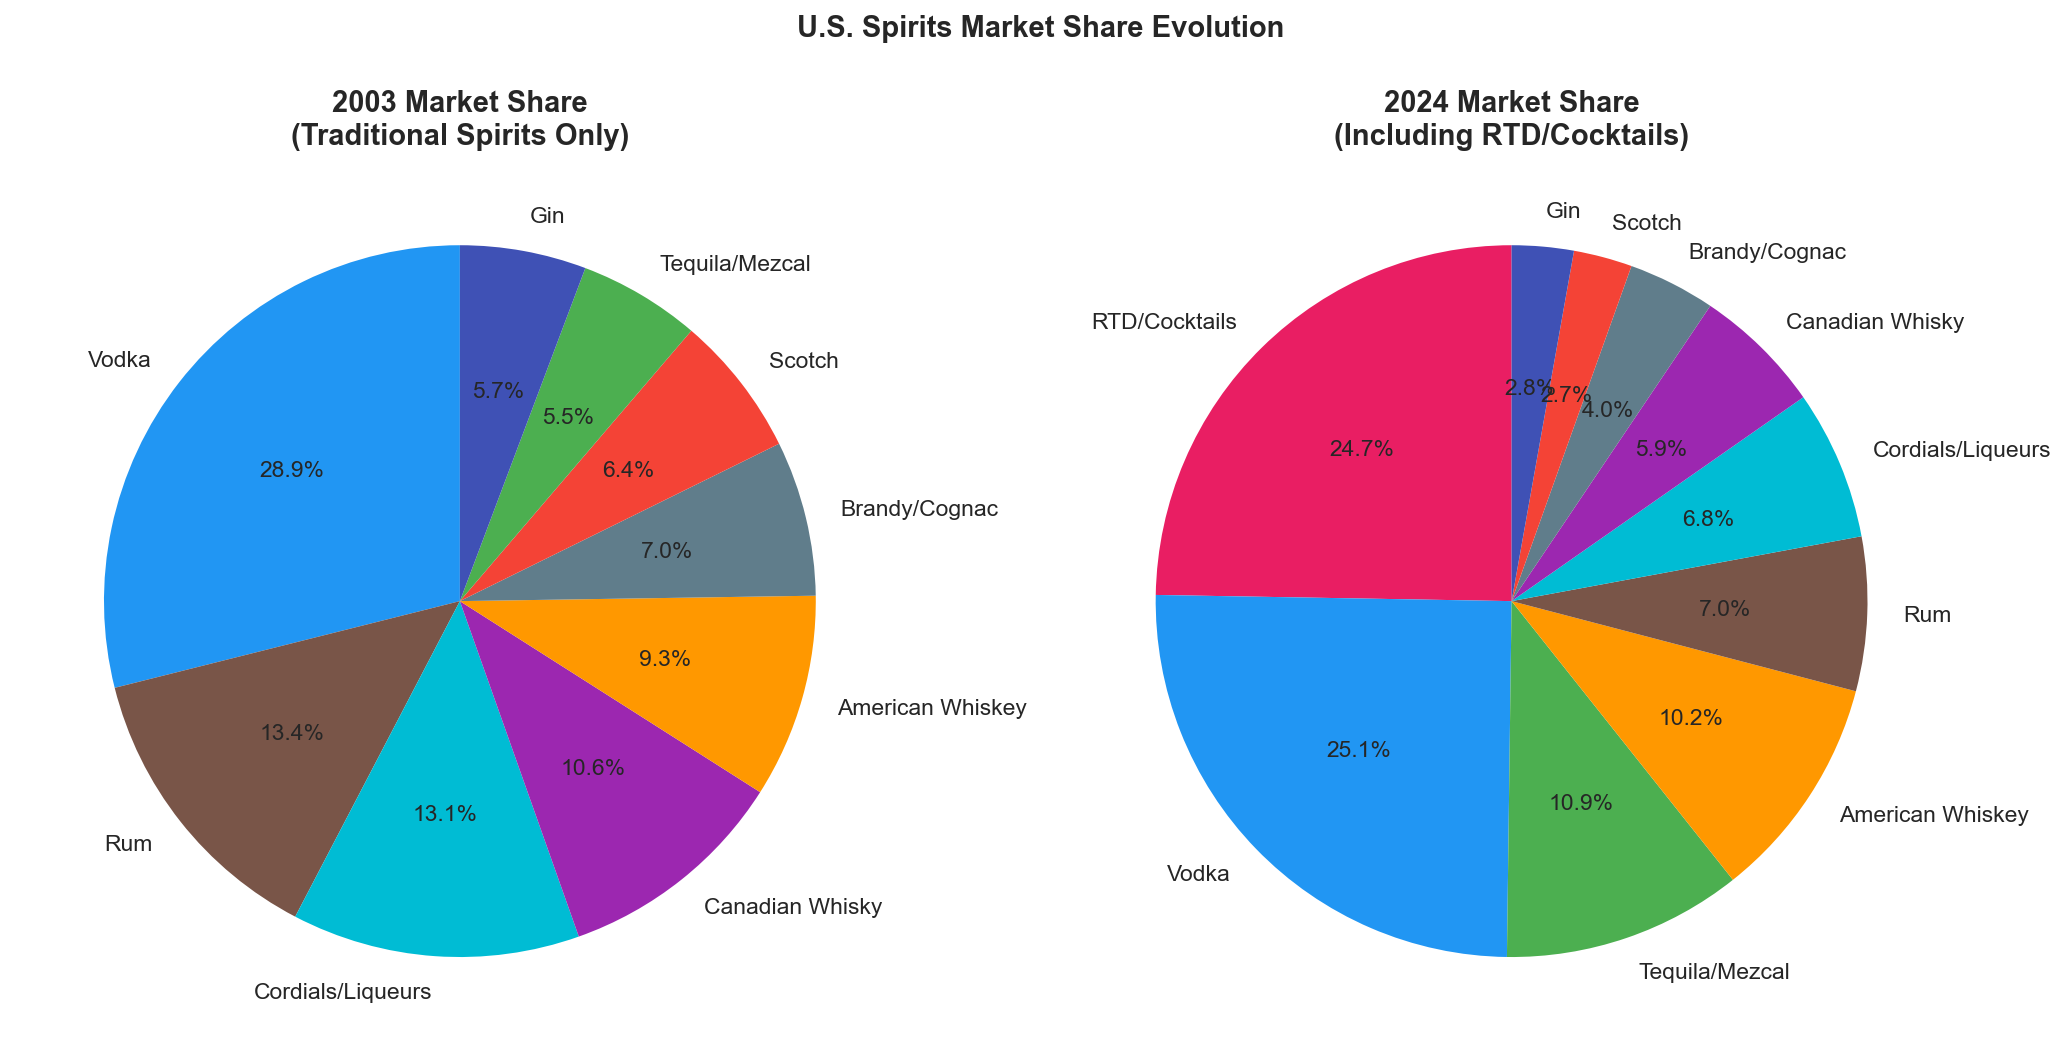
Figure 3: Market Share Evolution - Tequila gained 8.6pp while Rum lost 4.3pp
Winners vs Declining Categories
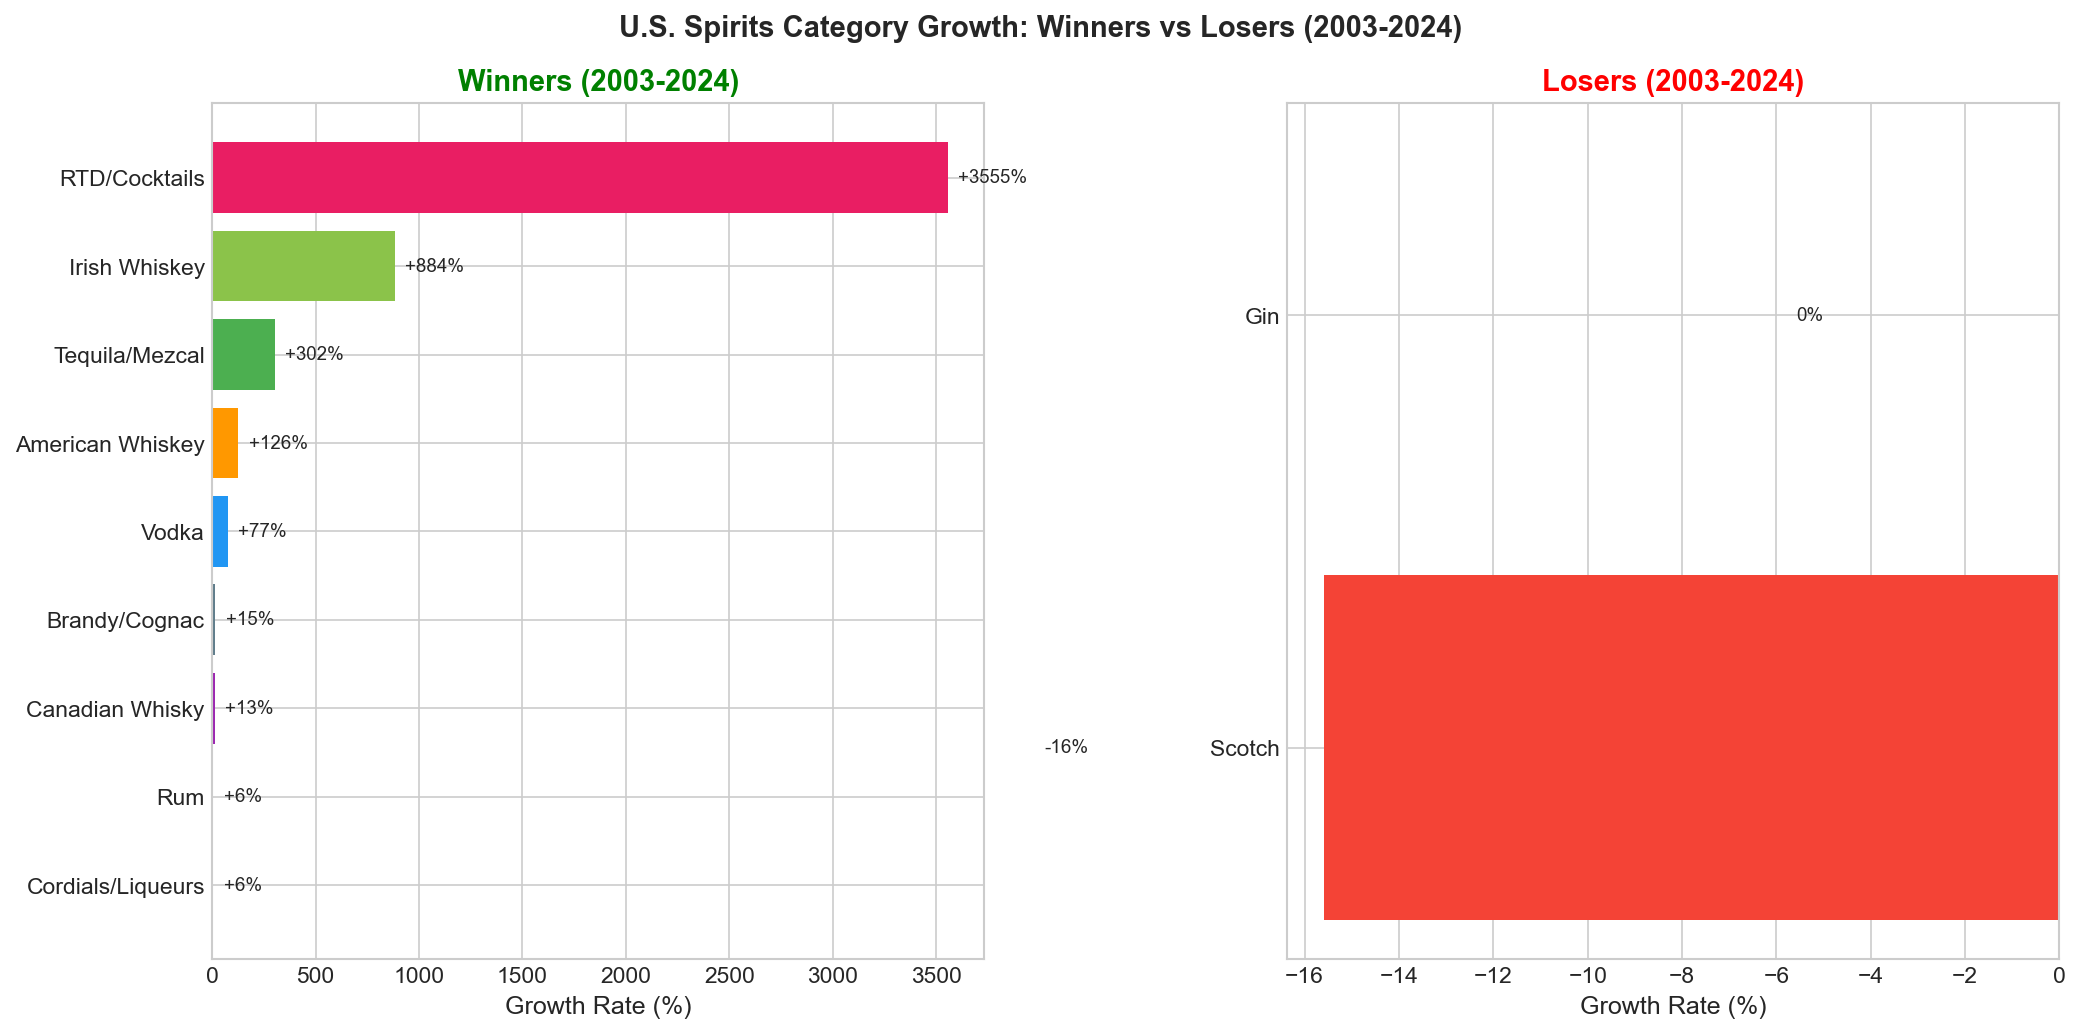
Figure 4: Growth categories (left) vs Declining categories (right)
Year-over-Year Performance
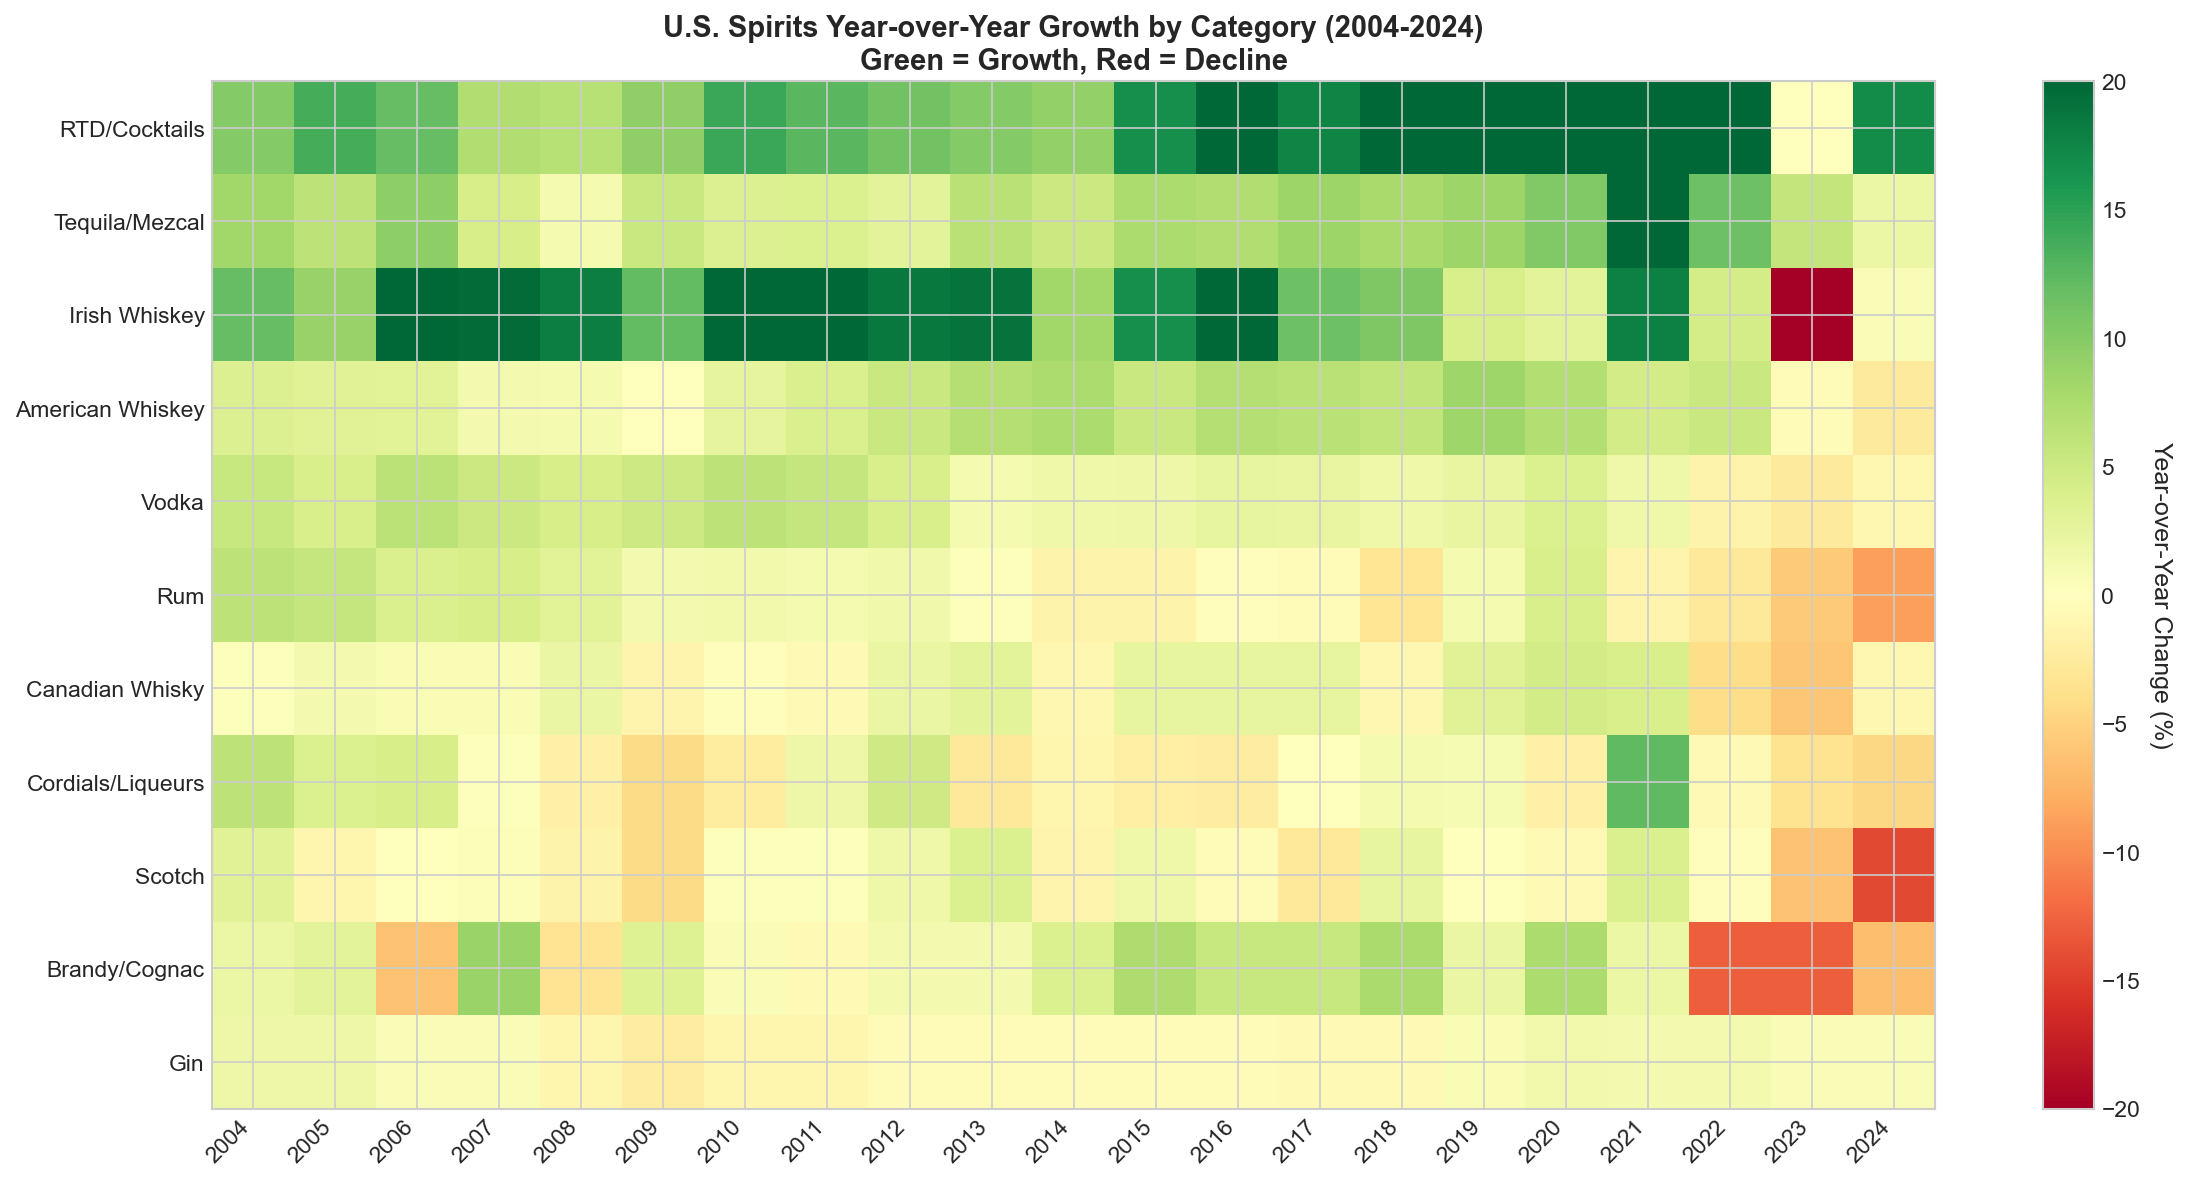
Figure 5: YoY Growth Heatmap - Green indicates growth, red indicates decline
Forecast Scenarios (2025-2029)
Aggressive Scenario
"The Decline Continues"
- Extrapolates 2021-2024 trends forward
- 10% annual dampening applied (each year, the growth/decline rate is reduced by 10% from the prior year to prevent unrealistic compounding)
- Total market: 216M cases by 2029 (-5%)
Dampened Scenario
"Mean Reversion"
- Blends recent and long-term trends
- Caps annual change at +5%/-3%
- Total market: 230M cases by 2029 (+1%)
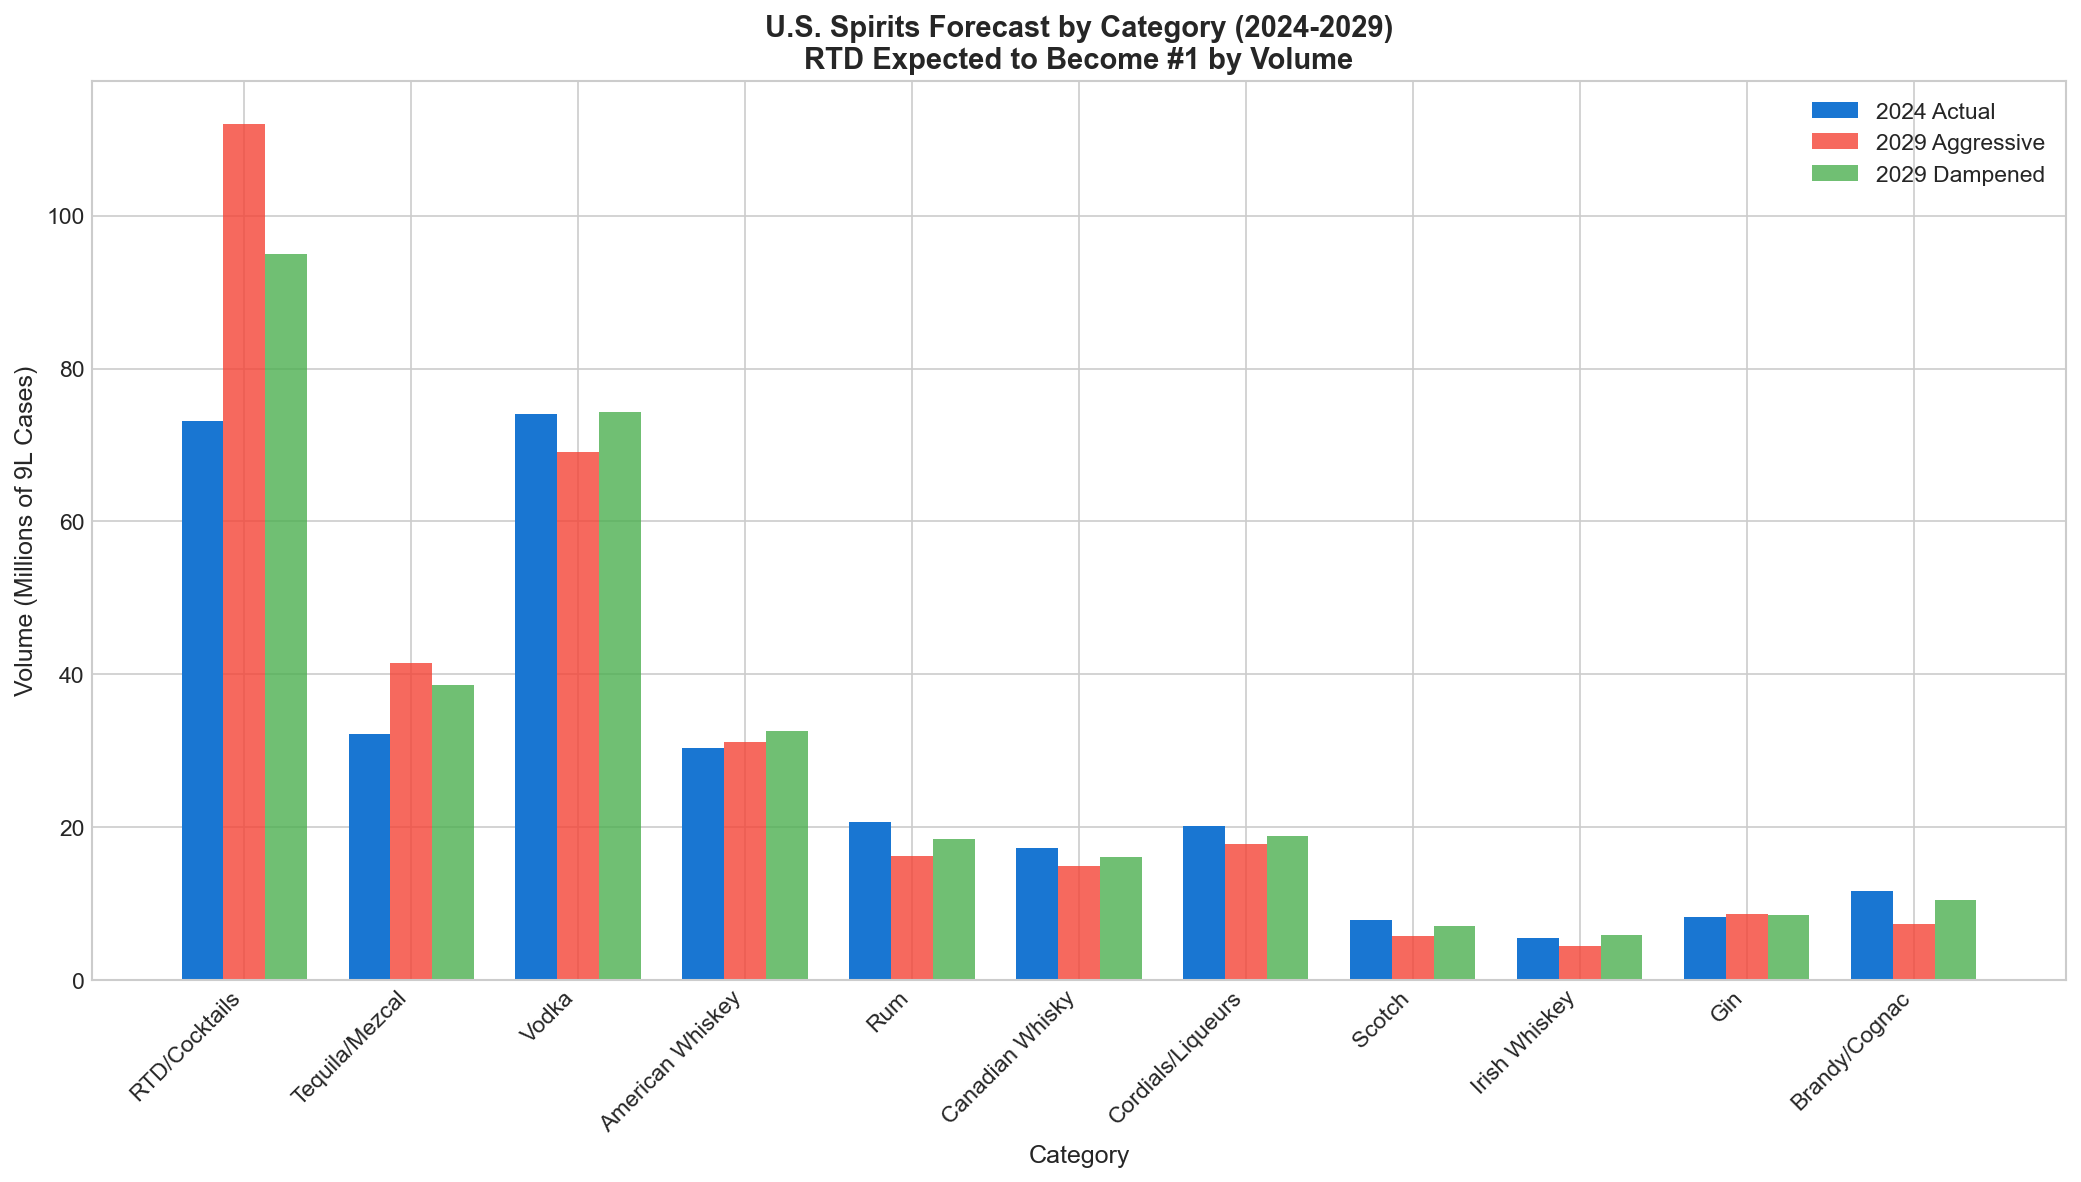
Figure 6: Category-level forecast scenarios
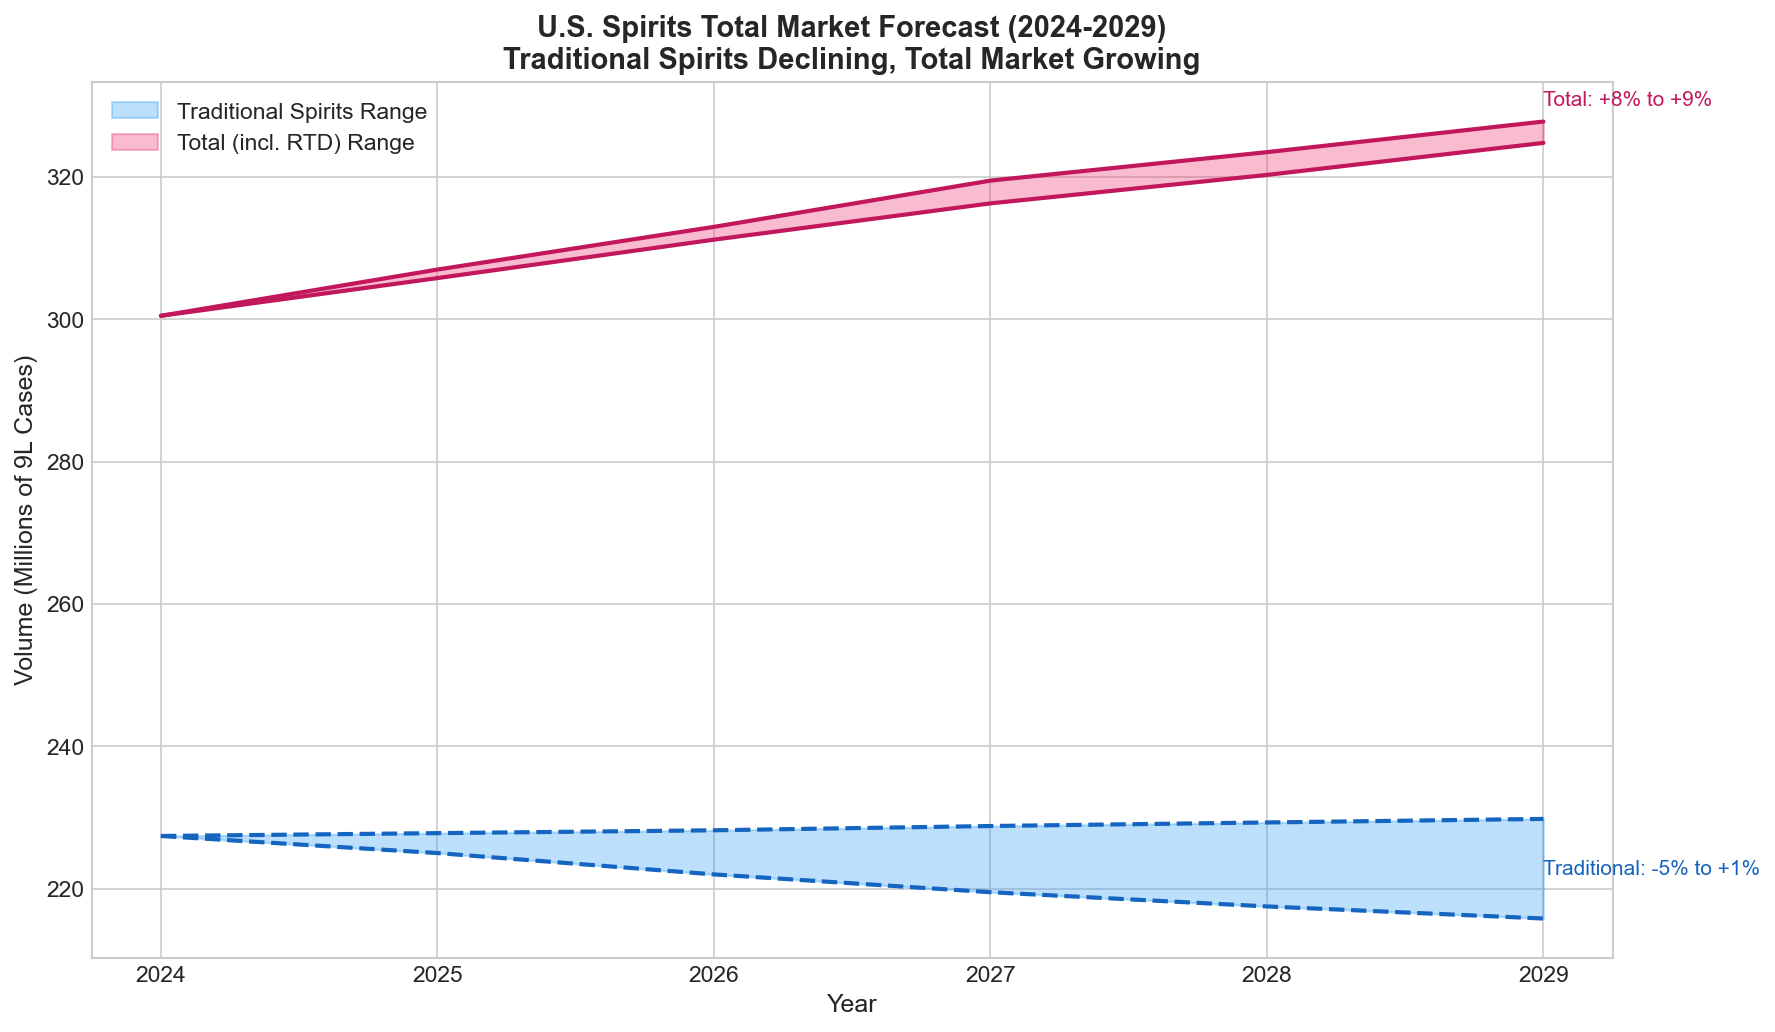
Figure 7: Total market forecast - expect 216M to 230M cases by 2029
Forecast Comparison by Category
| Category | 2024 | Aggressive 2029 | Change | Dampened 2029 | Change |
|---|---|---|---|---|---|
| RTD/Cocktails | 73.1 | 112.0 | +53.2% | 95.0 | +30.0% |
| Tequila/Mezcal | 32.2 | 41.5 | +28.7% | 38.6 | +20.0% |
| Vodka | 74.1 | 69.1 | -6.8% | 74.3 | +0.3% |
| American Whiskey | 30.3 | 31.1 | +2.7% | 32.6 | +7.5% |
| Rum | 20.7 | 16.2 | -21.6% | 18.5 | -10.6% |
| Canadian Whisky | 17.3 | 14.9 | -14.4% | 16.1 | -7.2% |
| Brandy/Cognac | 11.7 | 7.3 | -37.2% | 10.5 | -10.6% |
| Cordials/Liqueurs | 20.1 | 17.8 | -11.6% | 18.9 | -6.0% |
| Scotch | 7.9 | 5.8 | -26.0% | 7.0 | -10.6% |
| Irish Whiskey | 5.5 | 4.5 | -17.5% | 5.9 | +8.0% |
| Gin | 8.3 | 8.6 | +3.4% | 8.5 | +1.8% |
| Traditional Spirits | 227.4 | 215.8 | -5.1% | 229.8 | +1.1% |
| TOTAL (incl. RTD) | 300.5 | 327.8 | +9.1% | 324.8 | +8.1% |
Industry Analysis
Tequila/Mezcal Growth Drivers (+302%)
- Premiumization: Repositioned from "party shot" to sophisticated sipping spirit; 100% agave became quality marker
- Celebrity brands: Casamigos, Teremana, 818, Santo brought mainstream credibility and marketing firepower
- Cocktail culture: Margarita evolution from frozen/sweet to craft/fresh; Paloma and other serves expanded occasions
- Demographics: Hispanic population growth; Millennials/Gen Z view tequila as "their" category
Rum's Structural Decline
- Flavor fatigue: Spiced rum boom created category fatigue; flavored consumers migrated to RTDs
- Premiumization failure: Unlike tequila, rum failed to establish credible super-premium tier at scale
- Demographic misalignment: Younger consumers view rum as parents' spirit; -8.9% in 2024 suggests accelerating losses
American Whiskey vs Scotch
- American Whiskey success: Buffalo Trace scarcity created collector culture; craft/small batch resonated; sweeter profile more approachable
- Scotch struggles: Core consumers aging out; perceived as "dad's drink"; peated expressions polarizing; -14.3% in 2024
RTD Market Dynamics
- Malt-based RTDs (true competitors): Hard seltzers like White Claw and Truly contain no spirits—these capture occasions that would otherwise go to spirits categories
- Spirits-based RTDs (channel shift): Canned cocktails (High Noon, Cutwater) contain actual spirits; distillers participate in this growth as ingredient suppliers and brand owners
- Value capture shift: RTD brands capture margin that would have gone to bottle brands; consumer loyalty transfers to the RTD brand, not the base spirit
- Volume-per-occasion decline: A 4-pack of canned cocktails replaces a 750ml bottle purchase—same consumer, less retail spirits volume
- Strategic opportunity: Spirits producers can participate in RTD growth through vertical integration or B2B ingredient sales rather than viewing it purely as competitive displacement
Value Analysis: Volume Growth vs. Revenue Decline
Industry Revenue Trend (2020-2024)
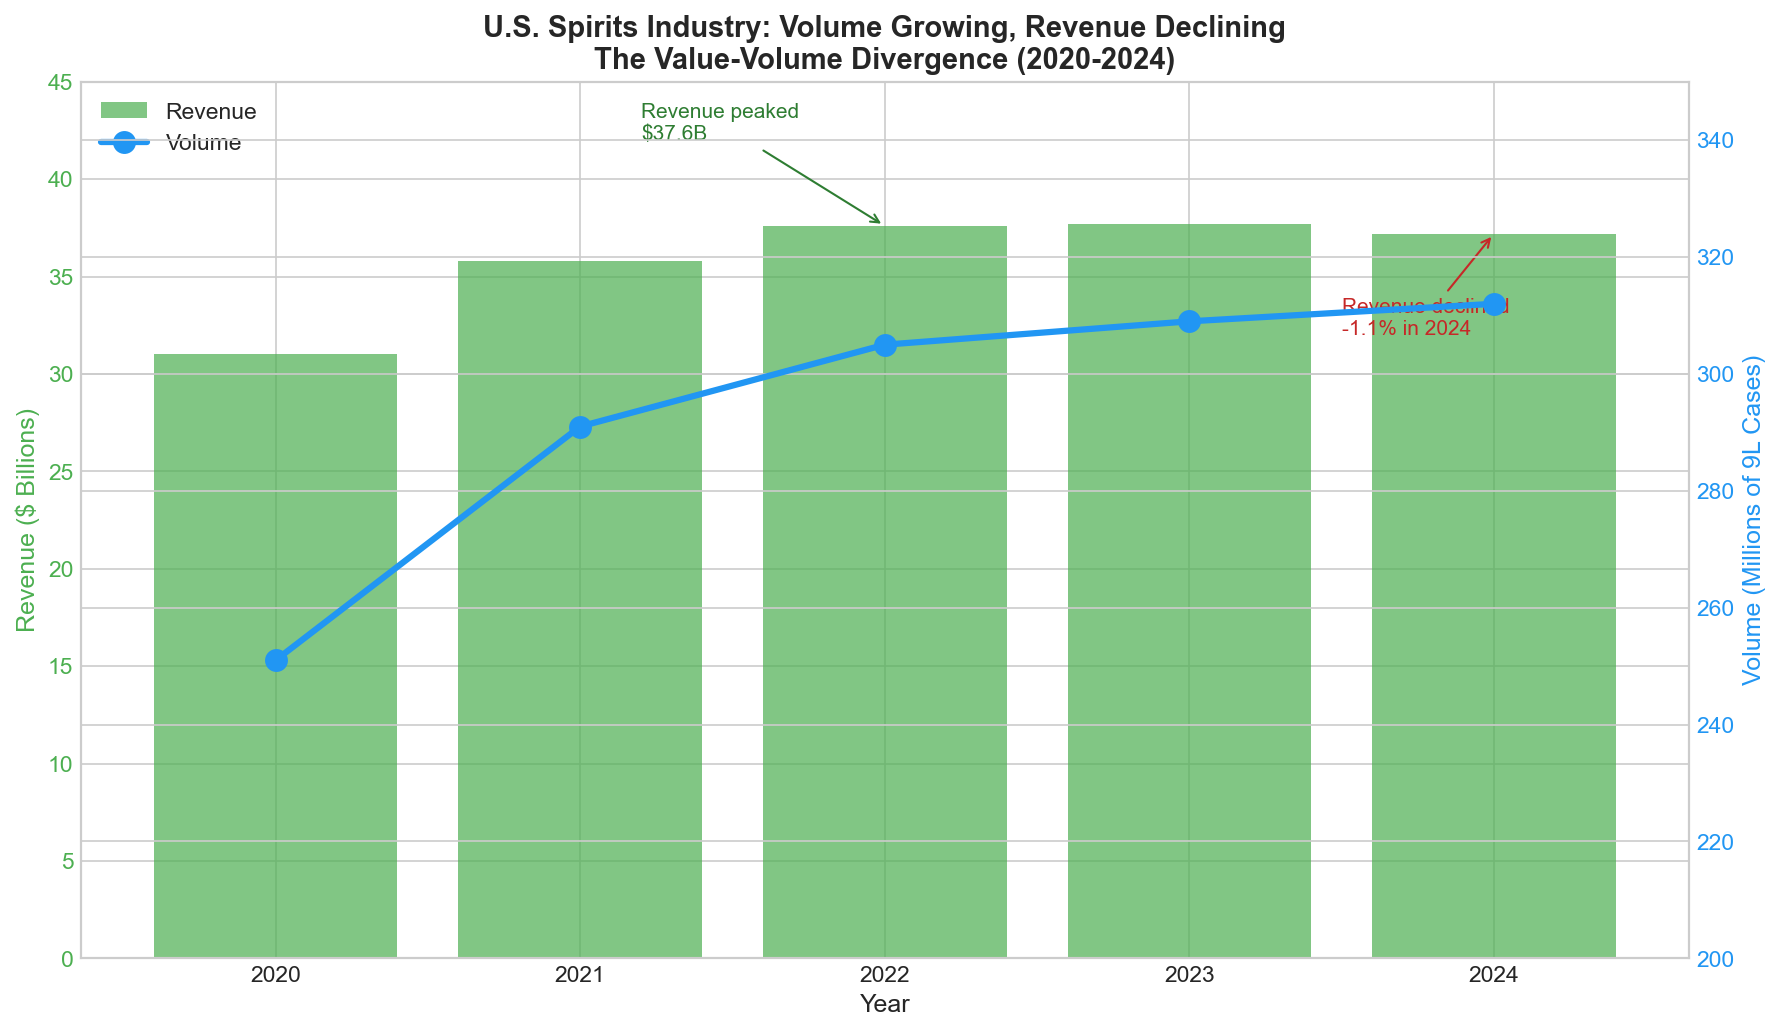
Figure 7: Revenue peaked in 2022 while volume continued growing - the value-volume divergence
| Year | Supplier Revenue | YoY Change | Volume (M cases) | Revenue/Case |
|---|---|---|---|---|
| 2020 | $31.0B | +5.5% | 251 | $123 |
| 2021 | $35.8B | +12.0% | 291 | $123 |
| 2022 | $37.6B | +5.1% | 305 | $123 |
| 2023 | $37.7B | +0.2% | 309 | $122 |
| 2024 | $37.2B | -1.1% | 312 | $119 |
Source: DISCUS Annual Economic Briefings 2020-2024
The Volume-Value Divergence
In 2024, volume grew +1.1% while revenue declined -1.1%. This means average revenue per case dropped ~2.2%—the industry is selling more units for less money.
| Metric | 2024 Performance | Implication |
|---|---|---|
| Total volume | +1.1% (312M cases) | Consumers still drinking |
| Total revenue | -1.1% ($37.2B) | But paying less per occasion |
| Revenue per case | -2.2% ($119) | Mix shift to lower-price products |
| Super-premium | -5.6% revenue | Premiumization stalled |
| Value tier | +3.5% revenue | Consumers trading down |
Why Revenue Is Declining
- RTD mix shift: RTDs growing +17% but at much lower price points ($12-18 per 4-pack vs $25-40 per 750ml bottle)
- Premiumization pause: Super-premium down 5.6%; value tier up 3.5%—consumers trading down amid inflation
- Lower revenue per occasion: A canned cocktail 4-pack replaces a bottle purchase at 40-60% of the price
- Brand value erosion: Loyalty transfers to RTD brands, not base spirits—distillers become commodity suppliers
Historical Context
- 2020-2022: Strong value growth driven by premiumization; 82% of 2021 revenue growth came from high-end/super-premium
- 2023: Stagnation begins; revenue essentially flat (+0.2%)
- 2024: First revenue decline since pre-pandemic; mix deterioration accelerates
- Outlook: Depends on economic recovery and whether premiumization resumes
Other Competitive Pressures
- Cannabis: 10-15% alcohol reduction in legal states; younger consumers willing to substitute
- Moderation: Gen Z drinking significantly less; "sober curious" movement gaining traction
Regulatory Considerations
- Tariff risk: Scotch, Irish, Cognac, Tequila vulnerable to trade disputes; domestic spirits would gain advantage
- Three-tier system: Distributor consolidation concentrates power; DTC shipping restricted in most states
February 2026 Addendum
1. Tequila Deep Dive Findings
| Finding | Detail |
|---|---|
| Growth Phase | Transitioning from high-growth (+20.8% in 2021) to stable-growth (+2.0% in 2024) |
| Premiumization | Super-premium ($255+) = 48% of revenue; 100% agave now 60% of market |
| Agave Supply Flip | Prices crashed 84% (MXP 32-5/kg). Supply constraints eliminated for 3-5 years. |
| Brand Winners | Don Julio +28.2%; Patron -11.8%; Jose Cuervo -6.4% |
| Mezcal Reality | Down 3.7% volume in 2024-25. Complementary niche, not "next tequila." |